


The measurement layer for self-hosted intelligence.
AI research and products that put you in control of your organization's intelligence.

Gemma 2
2B-7B

Phi-4
14B

DeepSeek
V3 - R1

Mistral
7B - 123B

Qwen 2.5
0.5B - 72B

Llama 3.1
8B - 405B
Intelligence on your Terms
Learn how XR Labs is advancing research in open-weight model performance
Extract total and items from scanned invoice.
Convert this Python endpoint into TypeScript code.
Transcribe audio call into written summary notes.
Run database query for last month's subscribers.
Extract total and items from scanned invoice.
Convert this Python endpoint into TypeScript code.
Transcribe audio call into written summary notes.
Run database query for last month's subscribers.
Intelligence on your Terms
Learn how XR Labs is advancing research in open-weight model performance
01
Observe
Measurement
Hardware behaviour and output quality on one timeline, from one run.
Measure your models
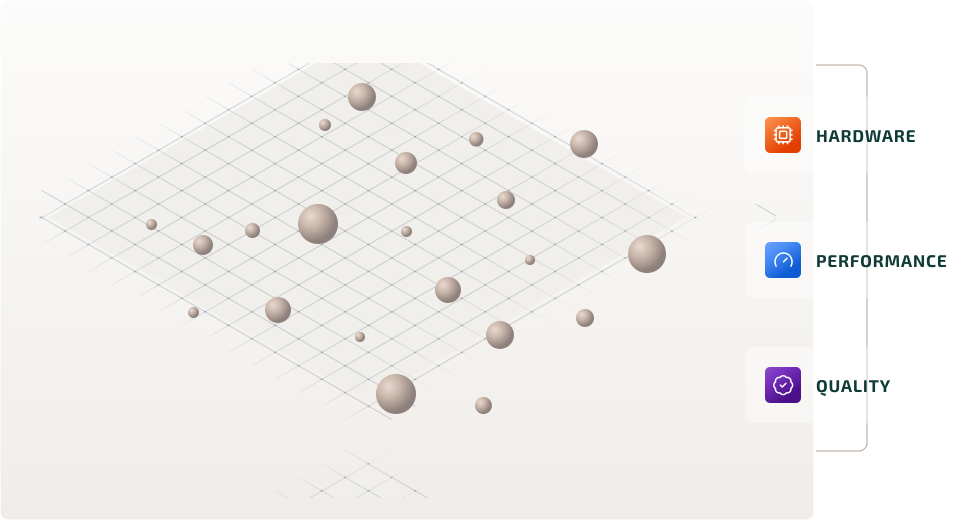
Complex systems often appear chaotic until we discover how to measure them. Around 240 BCE, Eratosthenes used shadow angles from two Egyptian cities to calculate the circumference of the Earth with remarkable accuracy.
AI presents a similar challenge. A complex landscape of models, hardware, and workloads becomes intelligible when observed systematically and under consistent conditions.
The first step toward understanding any complex system is knowing what to measure.
02
Understand
Organization
Every candidate model scored on your workloads, against the thresholds you set.
Compare your models
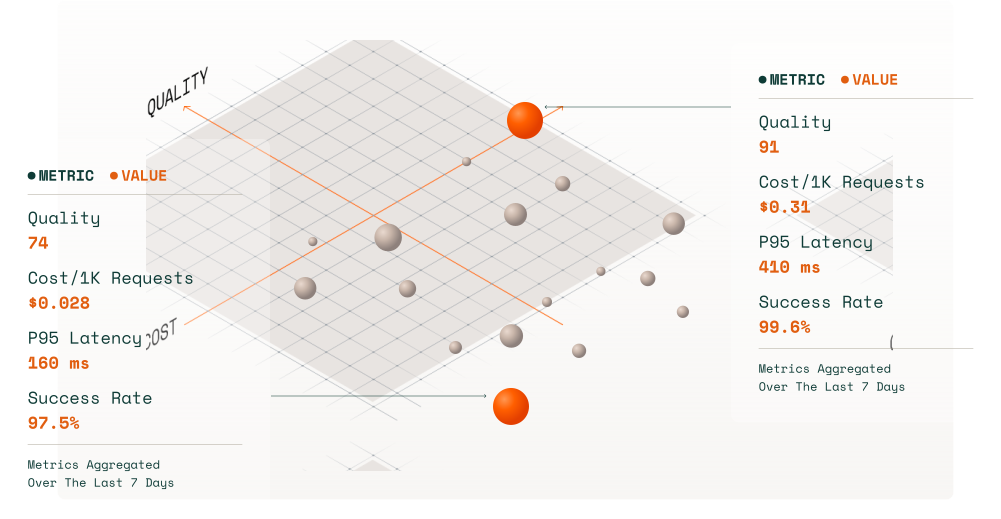
Complexity is not the same as randomness. Chaos theory showed that seemingly unpredictable systems can contain underlying patterns and structure.
We study model behavior across workloads, configurations, and operating conditions - organizing observations to reveal relationships, recurring patterns, and meaningful differences between models.
The challenge is not eliminating complexity. It is finding the structure within it.
03
Improve
Informed Decisions
Every agent task routed to its best-fit model - inside your environment, on your evidence, at zero added latency.
Match your models
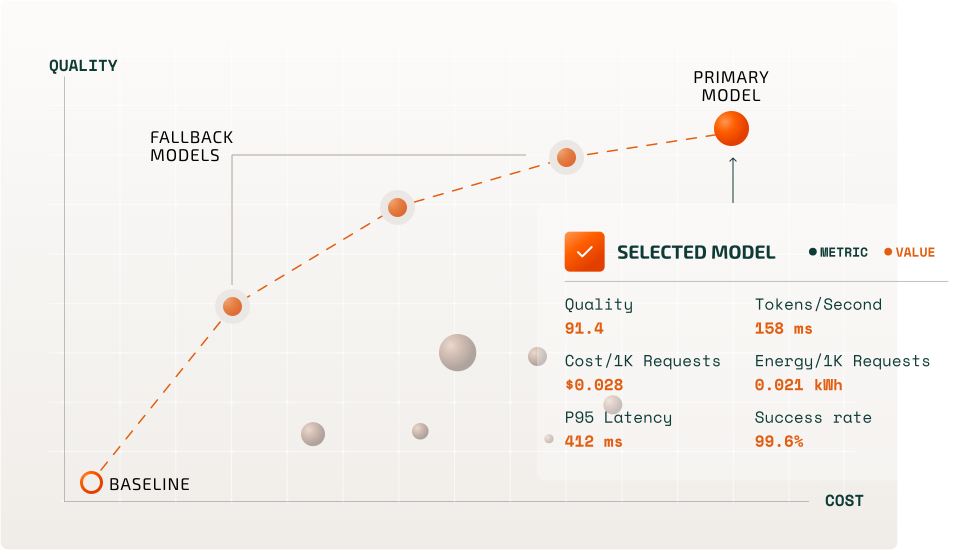
In 1854, John Snow mapped cholera deaths across London, revealing a pattern that led authorities to disable a contaminated water pump.
The same progression from evidence to action drives our research-backed routing product, using observed model behavior to match each task to the right model.
The result is using only as much model - and compute - as each task requires.
Get started
We are here to answer your questions.
Our technical sales team are here to answer your questions. If you would like to see our product in action - we'll stand up a demo environment that mirrors your production settings - so you see exactly how it behaves on your stack.