


//
Informed Decisions
End-to-End Model Performance Evaluation
01
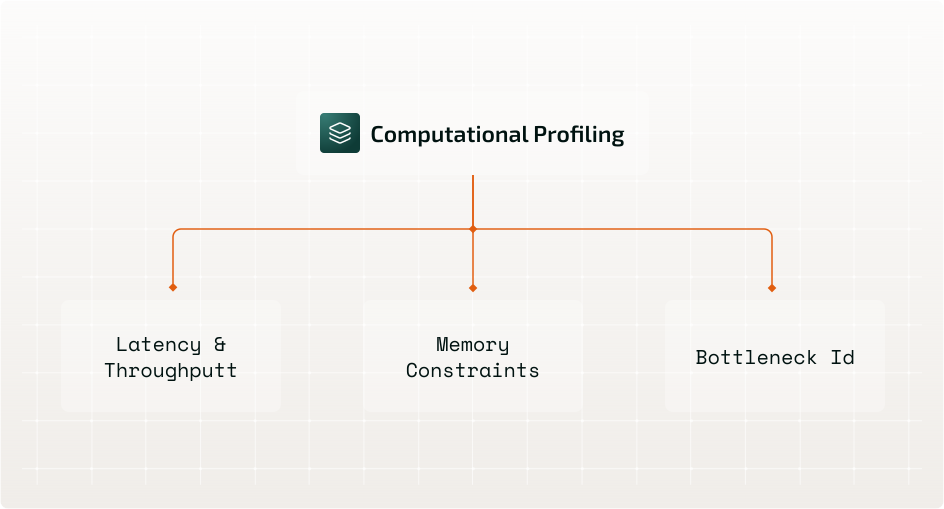
Computational Profiling
How your model and pipeline consume hardware, run by run.
Latency & Throughput
How long a single inference step takes, and how many queries or tokens the model clears per second.
Memory Constraints
Memory bandwidth and allocation profiled to catch OOM before large batches hit it.
Bottleneck Identification
Which operations stall execution or saturate the GPU - matrix multiplications, data loading, tensor reshaping.
02
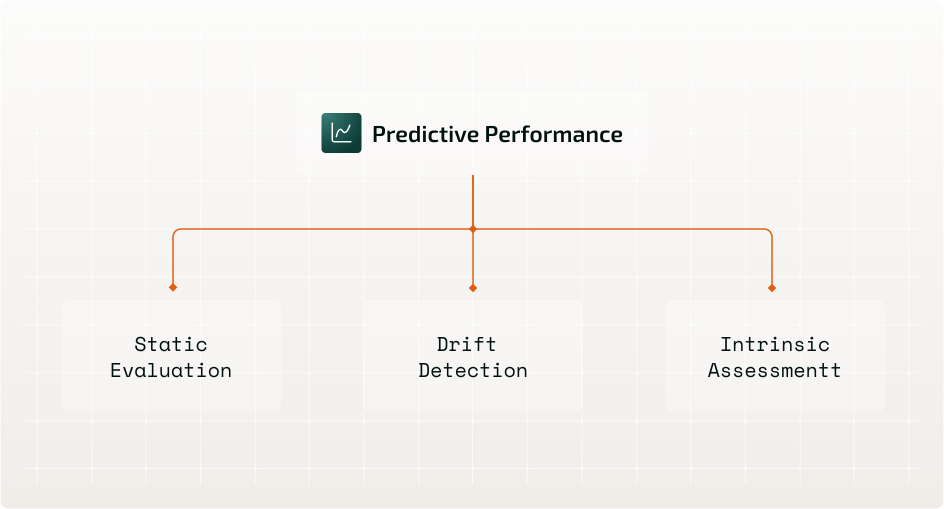
Predictive Performance
Whether the output still holds up - before deployment and in production.
Static Evaluation
Classification accuracy, F1, and BLEU/ROUGE for generative models, measured against known sets.
Drift Detection
Production inputs watched for statistical divergence from training data, before accuracy degrades.
Intrinsic Assessment
Latent performance profiling evaluates underlying reasoning, not just surface-level scores.
03
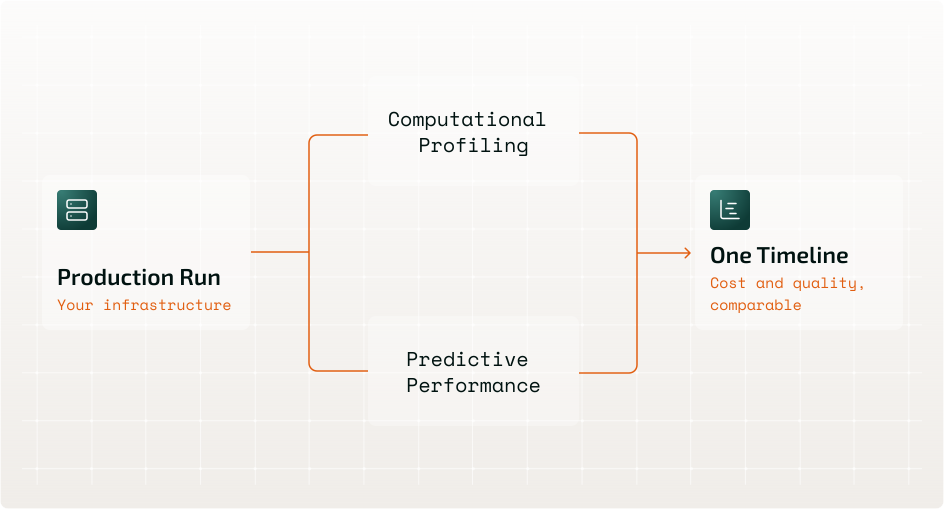
One Timeline
Both dimensions read from the same execution, so cost and quality are comparable.
Single Source Run
Hardware behaviour and output quality captured together - no stitching two toolchains.
Continuous Capture
Every production run adds evidence. Nothing is sampled away or reconstructed later.
No Data Egress
Instrumentation runs inside your environment. Telemetry never leaves your walls.
Get started
We are here to answer your questions.
Our technical sales team are here to answer your questions. If you would like to see our product in action - we'll stand up a demo environment that mirrors your production settings - so you see exactly how it behaves on your stack.